Road pavement inspection
Inspect road pavement conditions in a single pass, with no cloud dependencies. Keep your data on your premises, anonymized at source and GDPR compliant. Export your data in multiple formats, including GIS shapefiles, Excel and CSV.
Segment, classify, measure
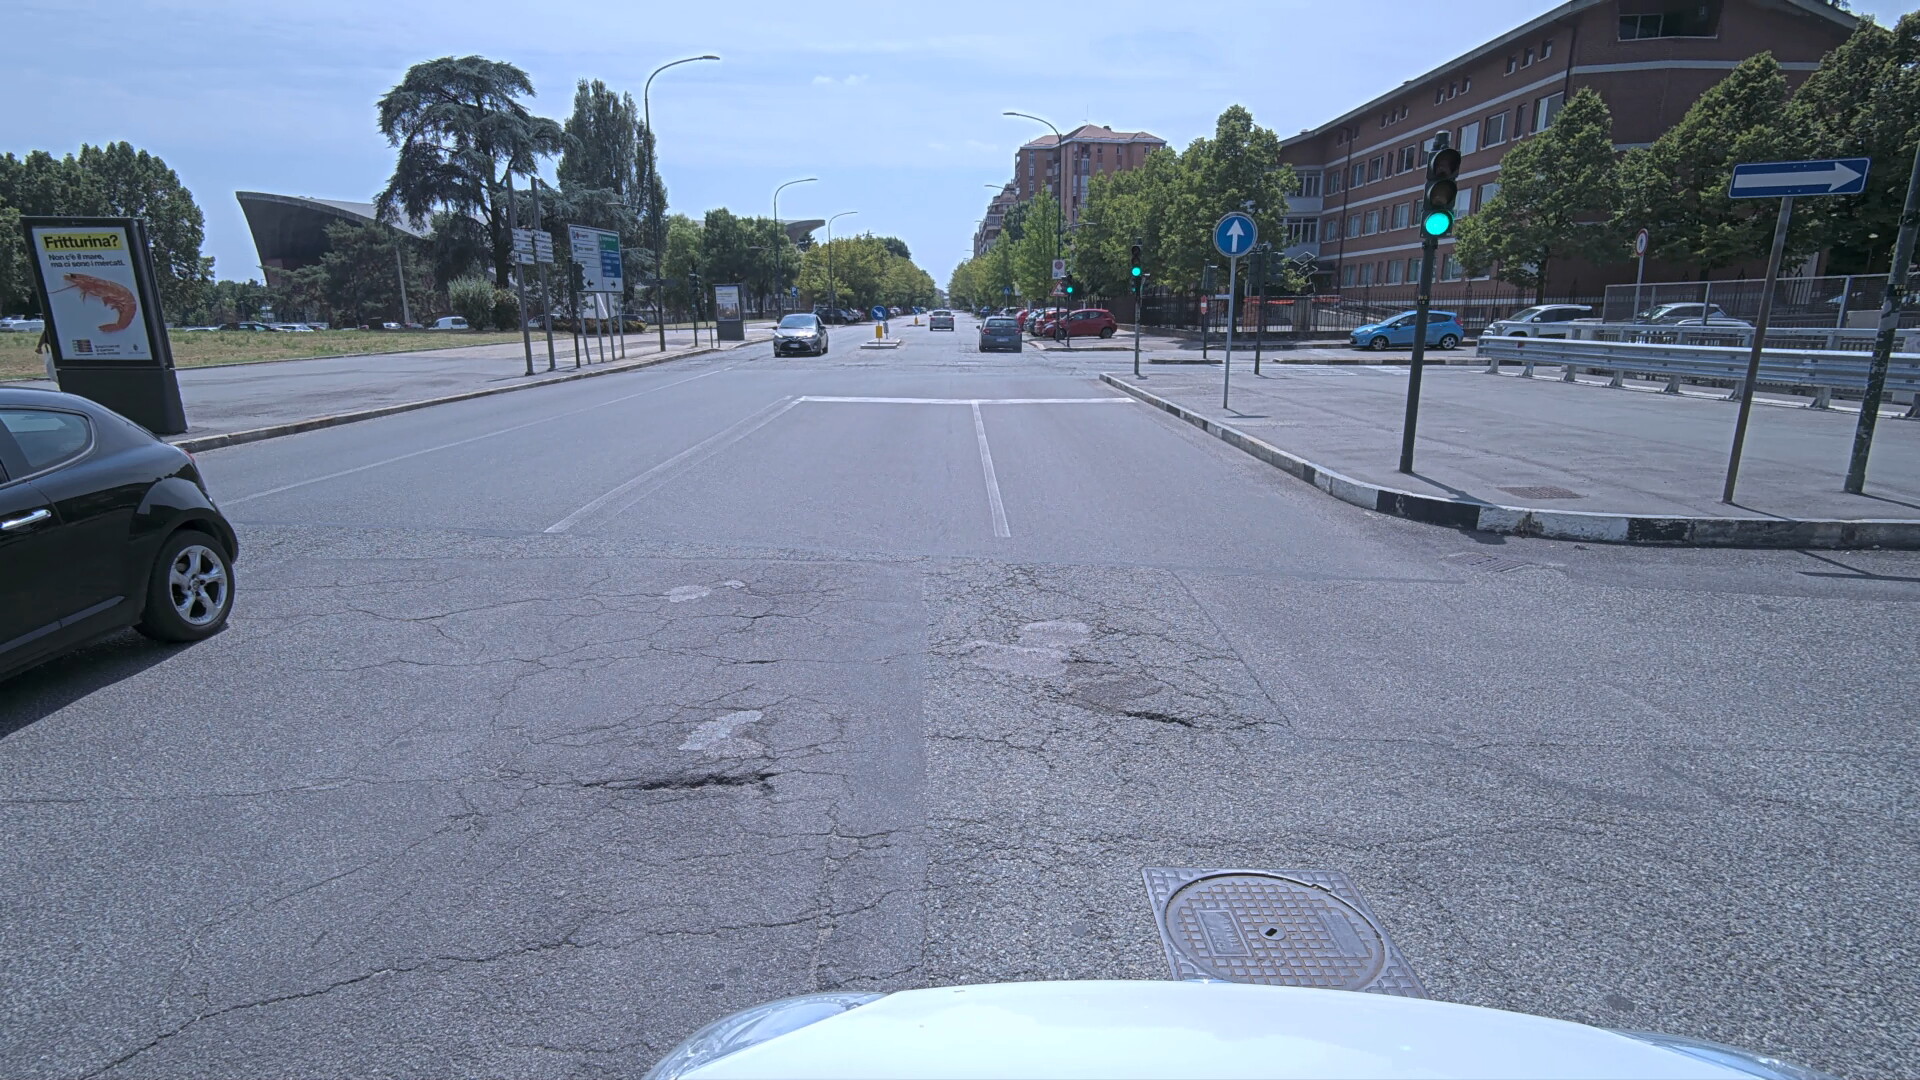
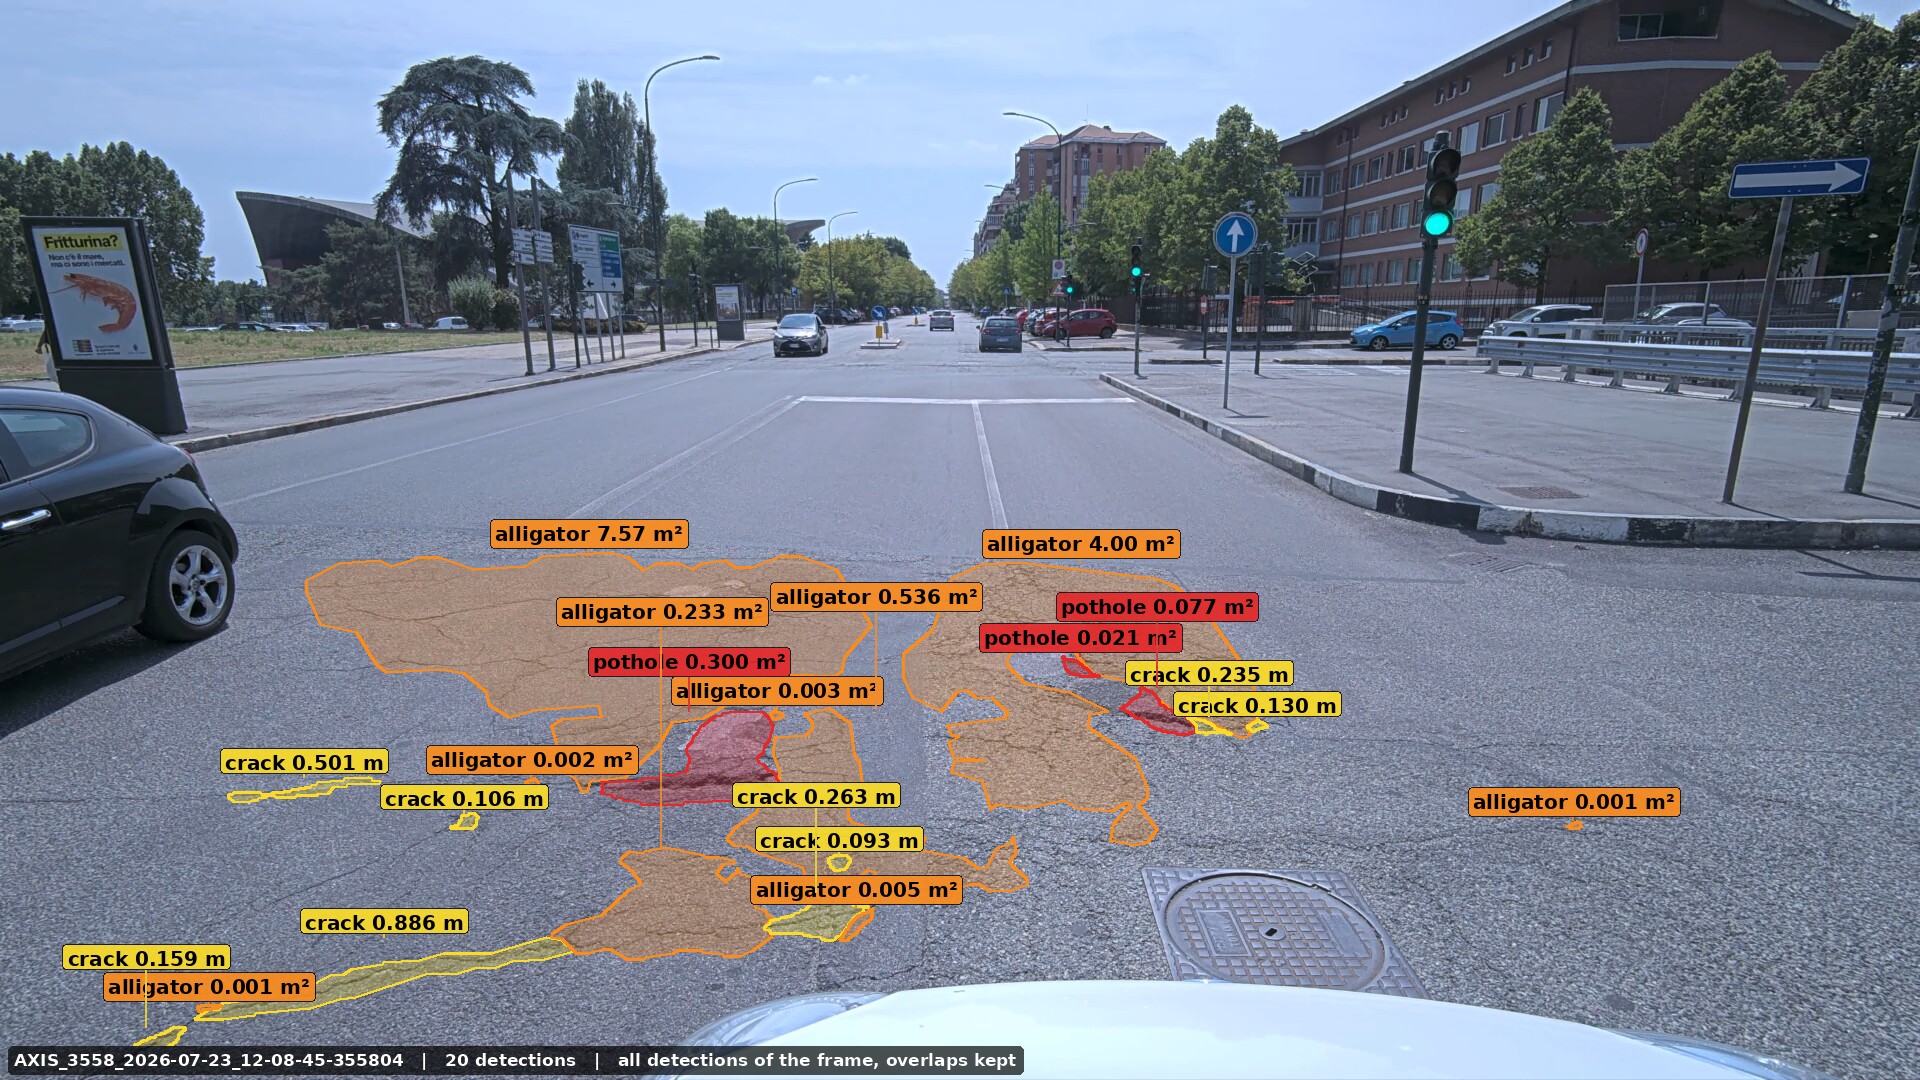
Turn any vehicle camera into a smart pavement inspection system, powered by advanced edge-based segmentation models. Unlock TraCK's full intelligence and high-precision GPS to go beyond basic detection and classification of potholes, alligator cracking, and linear cracks—maintaining frame-by-frame consistency, accurately mapping defects in space or across lanes, and measuring crack length or pothole area.
A single pass, many defects
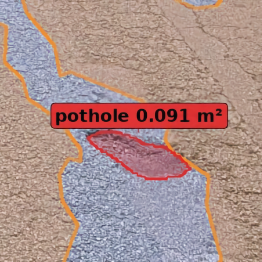
Potholes
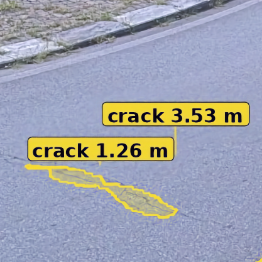
Linear cracks
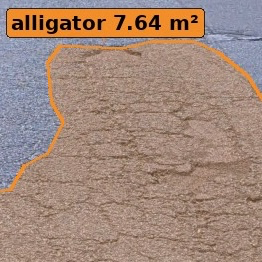
Alligator cracks
Your data, your platform
Privacy and data ownership are non-negotiable. On your roads, your data stays yours: TraCK never uploads images to the cloud, natively blurs faces and license plates in real time, and processes frames directly on your vehicle's onboard PC. Limited onboard computing power? Easily offload survey imagery to run TraCK analytics on your local server instead. Whichever workflow you choose, you retain total data freedom with seamless exports to your existing platform.

GIS shapefile

CSV